
My history with spinning or indoor cycling goes back to when I was living in Manchester in 2012. My housemate at the time (hi, Hayley!) convinced me to join a gym and managed to cajole me into trying spin because it was the same instructor that also did our yoga classes. Yes, it was major whiplash to go from spinning to yoga back-to-back, but he made it work.
After a few years of spin classes at the gym and trying to find English spin classes when I lived in Paris, once I got to New York, I had some space again and decided to try Peloton for the convenience of working out from home. I’d previously tried it in a hotel gym on a work trip and some friends recommended it very highly.
Instantly, I was hooked! I found the style of classes, the variety of workout types, and — let’s face it — their prime asset, the instructors, totally captivating. I was well and truly sucked into the cult.
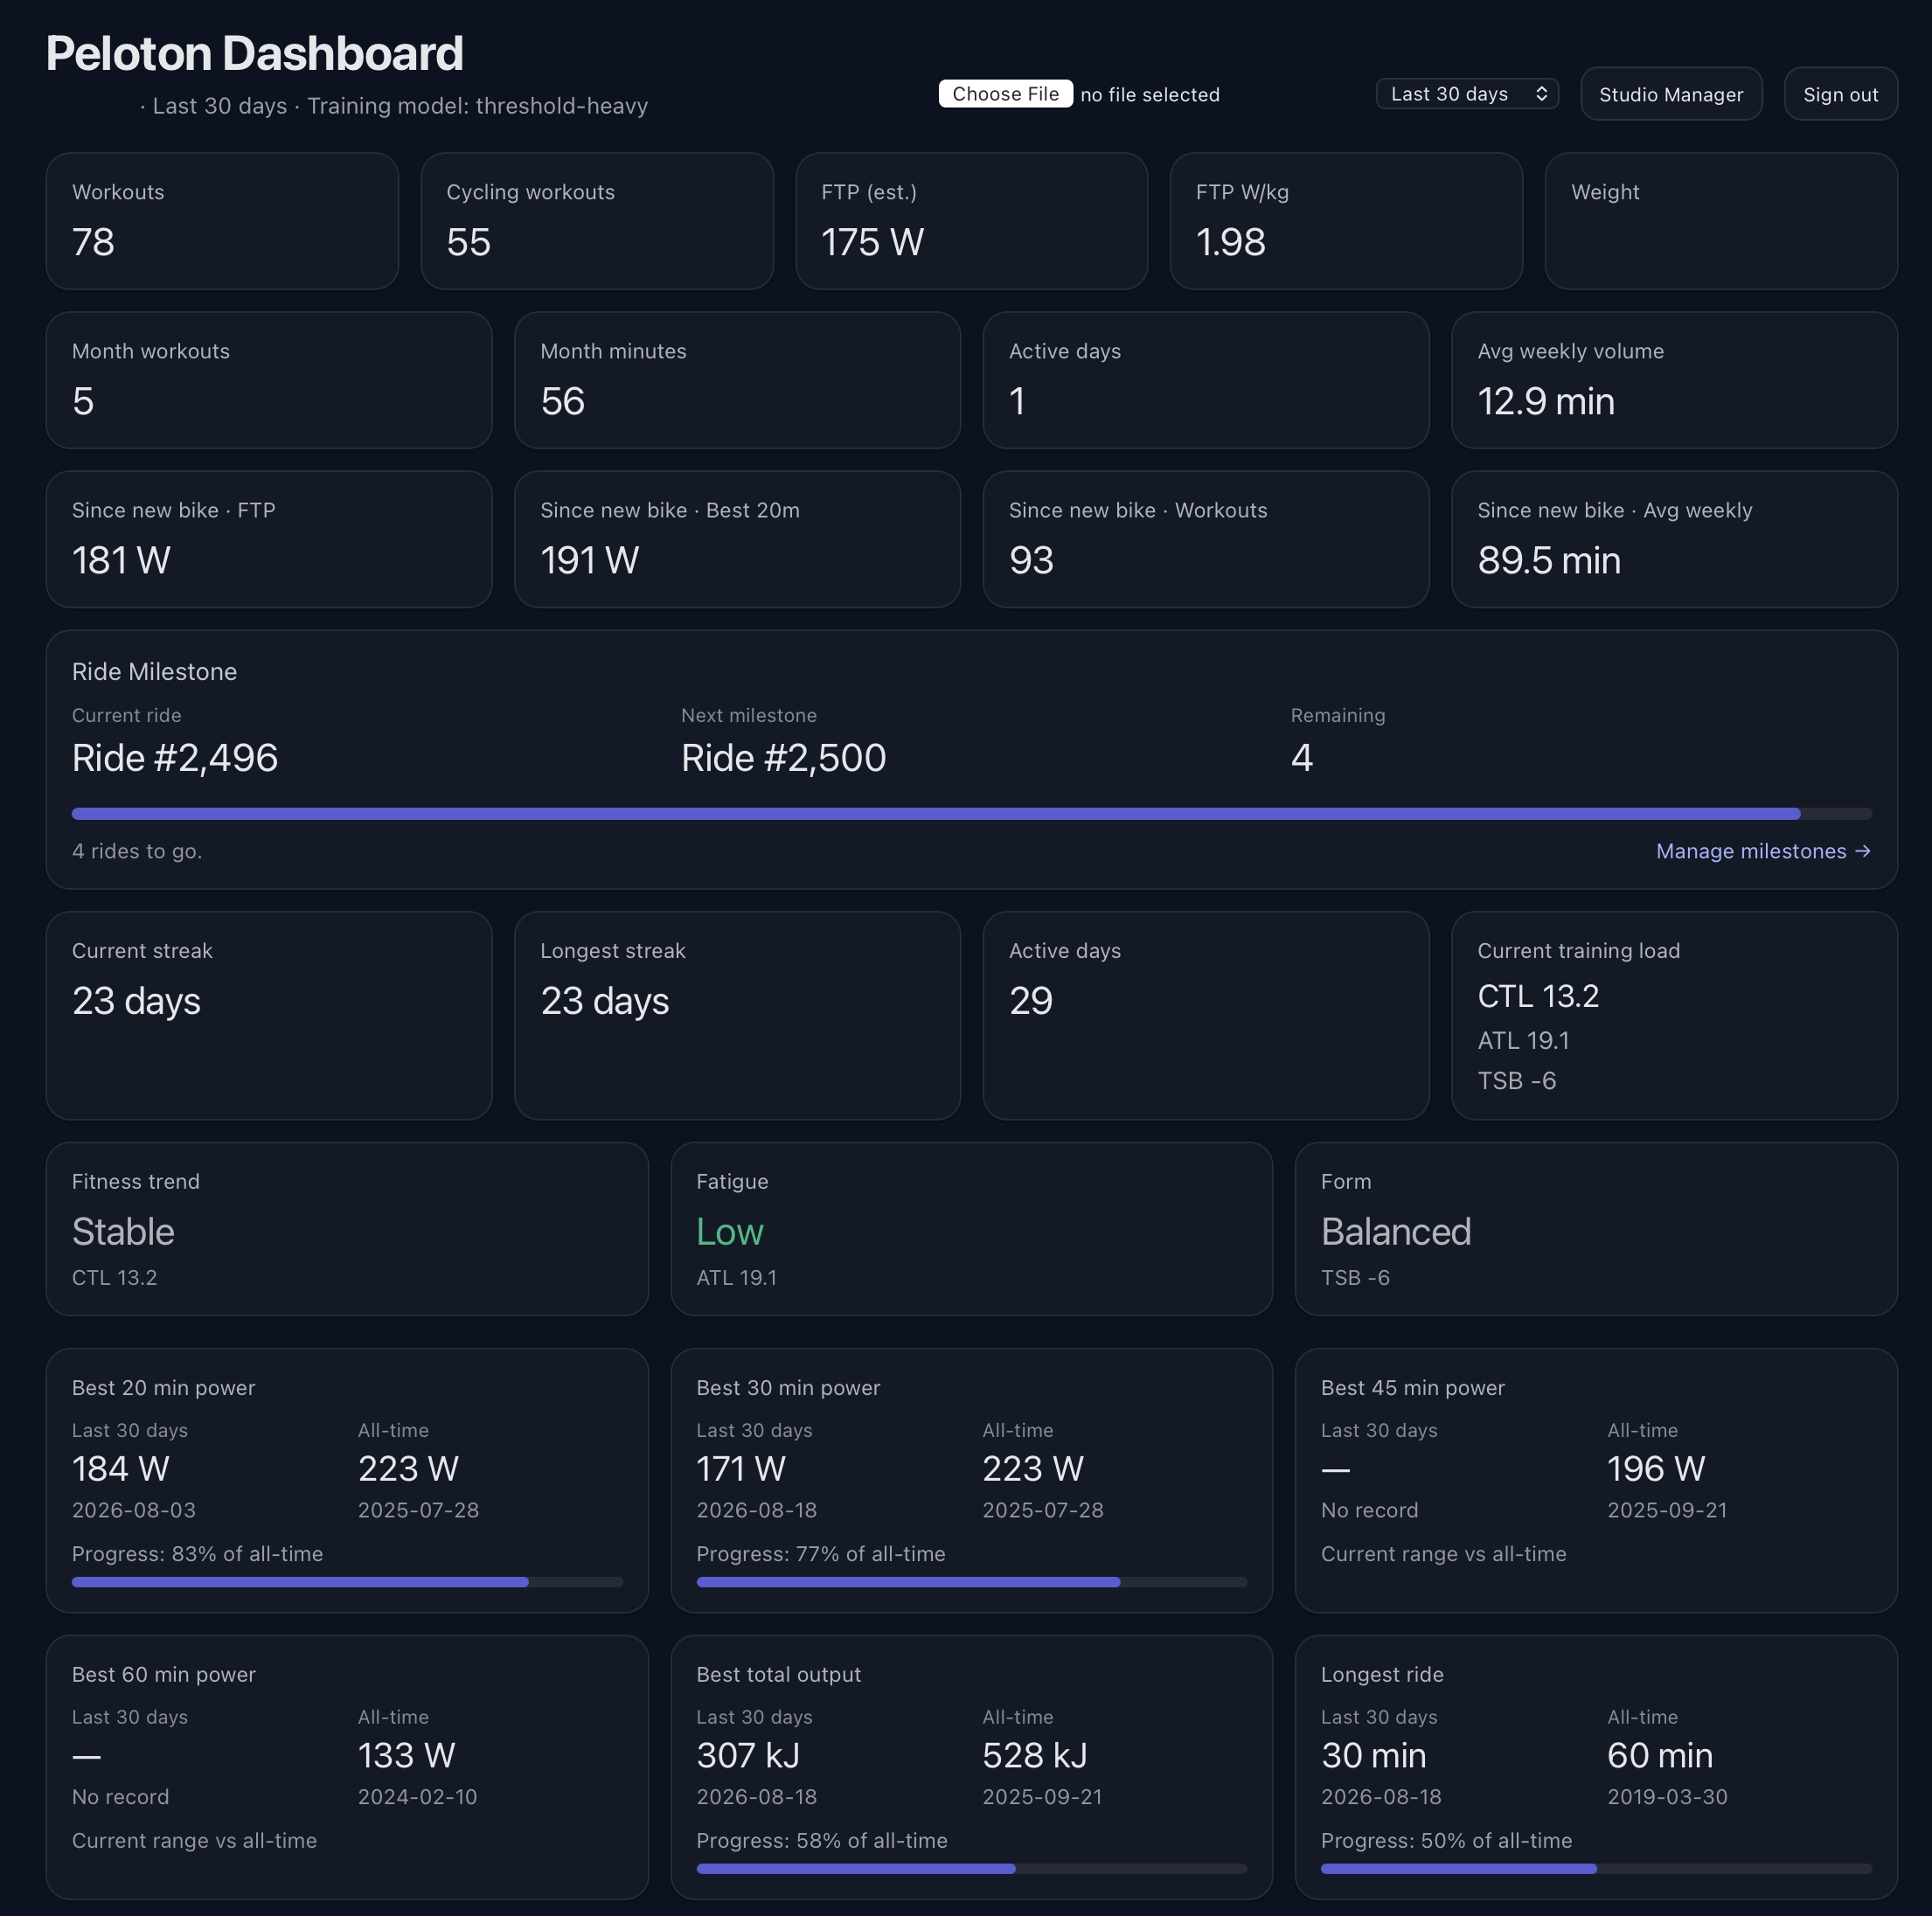
As someone who works with a lot of data, I really value good analytics to tell me what’s going on, and for Peloton data, that’s the same. Peloton itself gives you plenty of workout data, but I wanted a better way to analyse that over time, to see trends and possible areas for improvement or focus.
Since early this year, I’ve been experimenting with “vibe coding” using ChatGPT. I’ve used it to help me create utility scripts, perform maintenance on my Mac or troubleshoot issues. It’s been a real help in not just fixing the issues, but teaching me about the underlying tech.
Though I have some coding and programming skills, I’ve never studied it formally and it’s never been more than a hobby. I was listening to a podcast where the hosts were discussing creating personal software for their interests, and that got me thinking.
I’d already asked ChatGPT to analyse the workout data Peloton lets you export from its website, but I started to wonder if I could do more with it and turn the idea into a web app.
I started by working through what the app actually needed to do and what technology made sense for something this small. I settled on Next.js for the application and SQLite for the database: more than enough for one person’s workout history, without introducing a lot of infrastructure I didn’t need. Peloton’s own CSV export would be the source of truth, so the app wouldn’t depend on an unofficial API continuing to work.
A couple of evenings later, I had a working app that could import the file, add new entries to a database, and produce the analysis I was looking for. It’s got graphs, stats over time, milestone tracking, a studio visits log, the ability to look at things over different time periods, and even a weekly summary that I can use to compare my week-on-week performance.
This is where having built something specifically for myself really started to pay off. If I thought of a question I wanted the data to answer, I could work out how to add it.
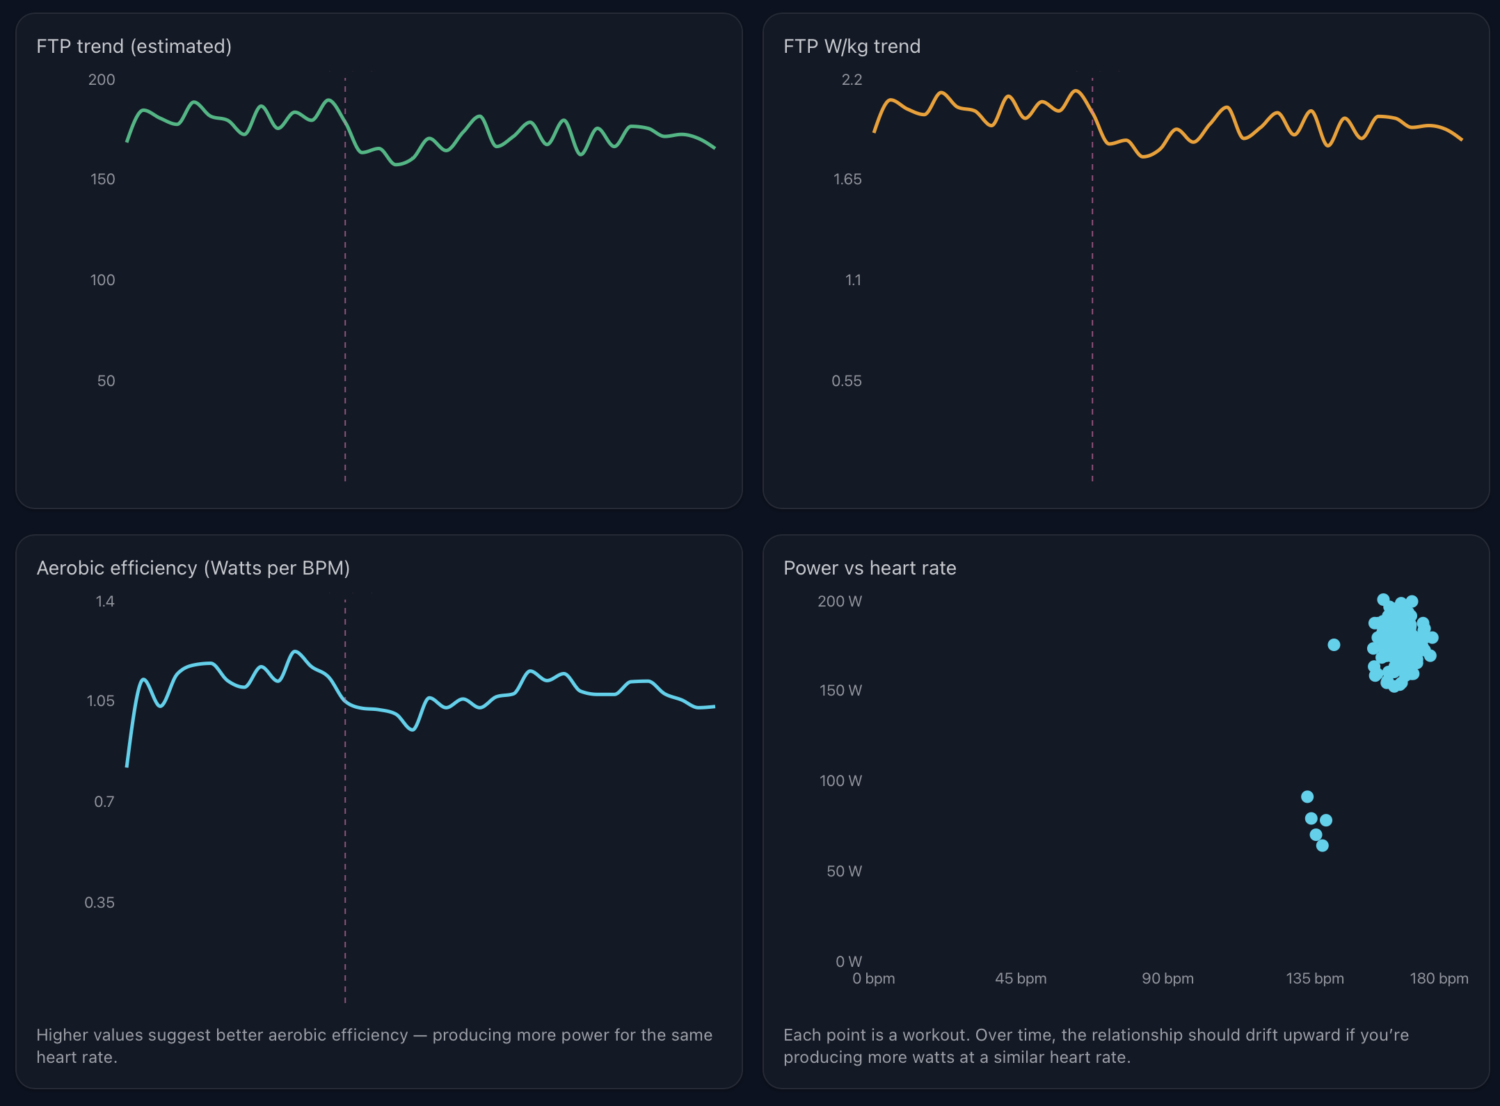
It’s incredibly specific to me and my needs, but that’s exactly what makes it so good and so useful. I can tweak it as I need and was able to add features over time. And best of all, it’s hosted in a corner of my existing web server, so it’s not costing me any subscription fees and won’t disappear like services do when they’re bought and later “sunset.”
As it might be helpful to others — though admittedly a very small group of people who love Peloton and running web apps — I’ve made it available on GitHub for anyone to download, run and customise as they see fit.
This is only one of the projects I’ve been encouraged to start after seeing what can be done. So there’ll be more on the others here soon. For now though, I’m enjoying learning, coding and trying new things.
If you do end up using it, drop me a line and let me know what you think.